Phase Diagram Manipulate and Refresh Window
|
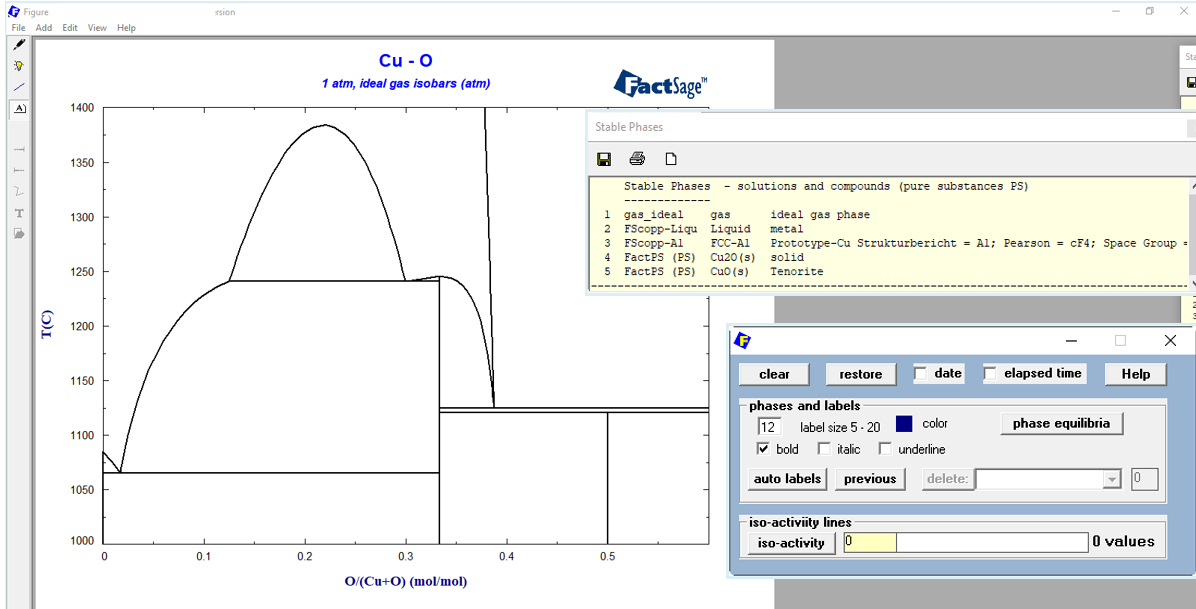
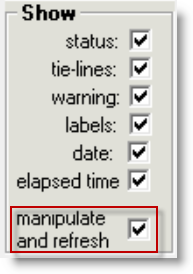
The Phase Diagram Manipulate and Refresh Window was first introduced in FactSage 7.2, enhanced in FactSage 7.3 and again in FactSage 8.0. It has become a popular app that offers a variety of editing and plotting options depending upon the type of calculated phase diagram. It is displayed right after the phase diagram has been calculated. The screenshot shows how to activate the Manipulate and Refresh Window via the Parameters Window ('Phase Diagram > Menu Window > Parameters') |
|
|
|
In FactSage 8.0 the Manipulate and Refresh Window has been restructered and new options added. In addition to the General options that apply to all diagrams, there are now 5 categories for manipulating the calculated phase diagram:
For example, only one of 'tie lines - isothermal diagram', 'polythermal projection' or 'aqueous diagram' could be displayed at any given time. |
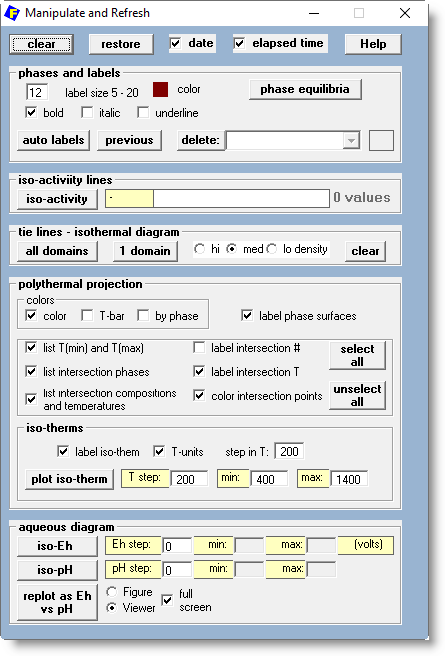
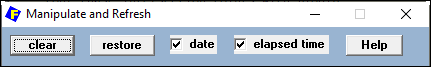
- clear - removes all items such as labels, tie lines, iso-therms, iso-activities, etc. that have been added after the calculation finished.
This option applies to all phase diagrams. - restore - displays the original diagram.
This option applies to all phase diagrams. - date - displays the date the original diagram was calculated.
This option applies to all phase diagrams. The date is posted in the bottom right corner. - elapsed time - displays the time taken to calculate the original diagram.
This option applies to all phase diagrams. The time is posted in the bottom right corner. - help - displays the web page you are currently viewing .
|
|
|
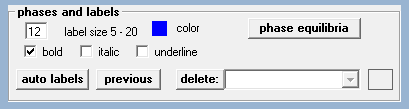
- label - size, color, bold, italic and underline.
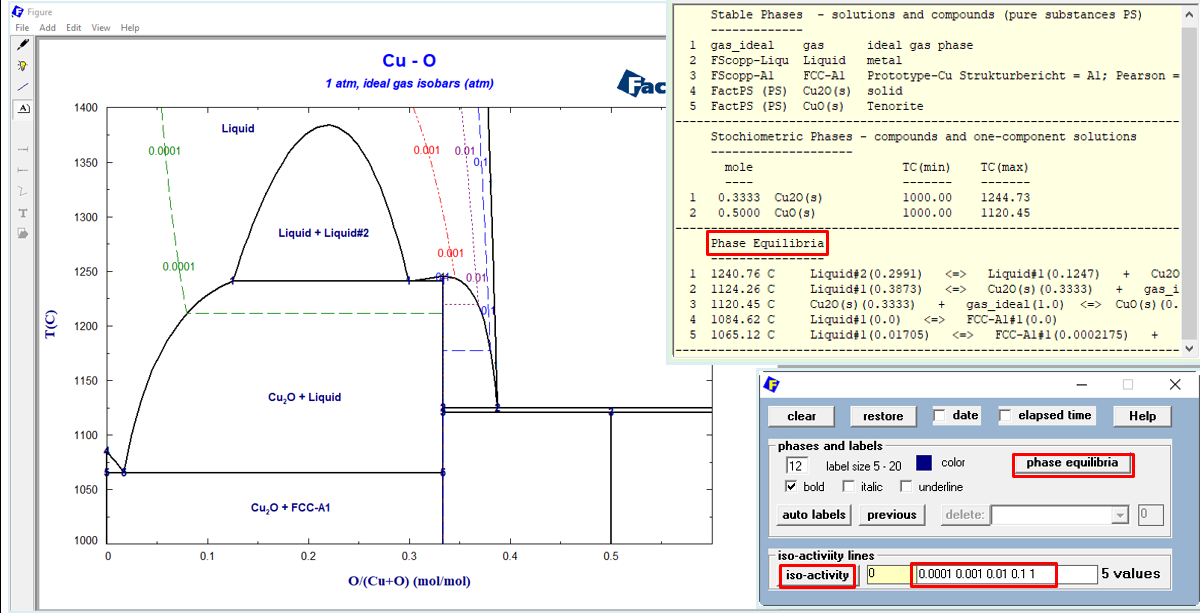
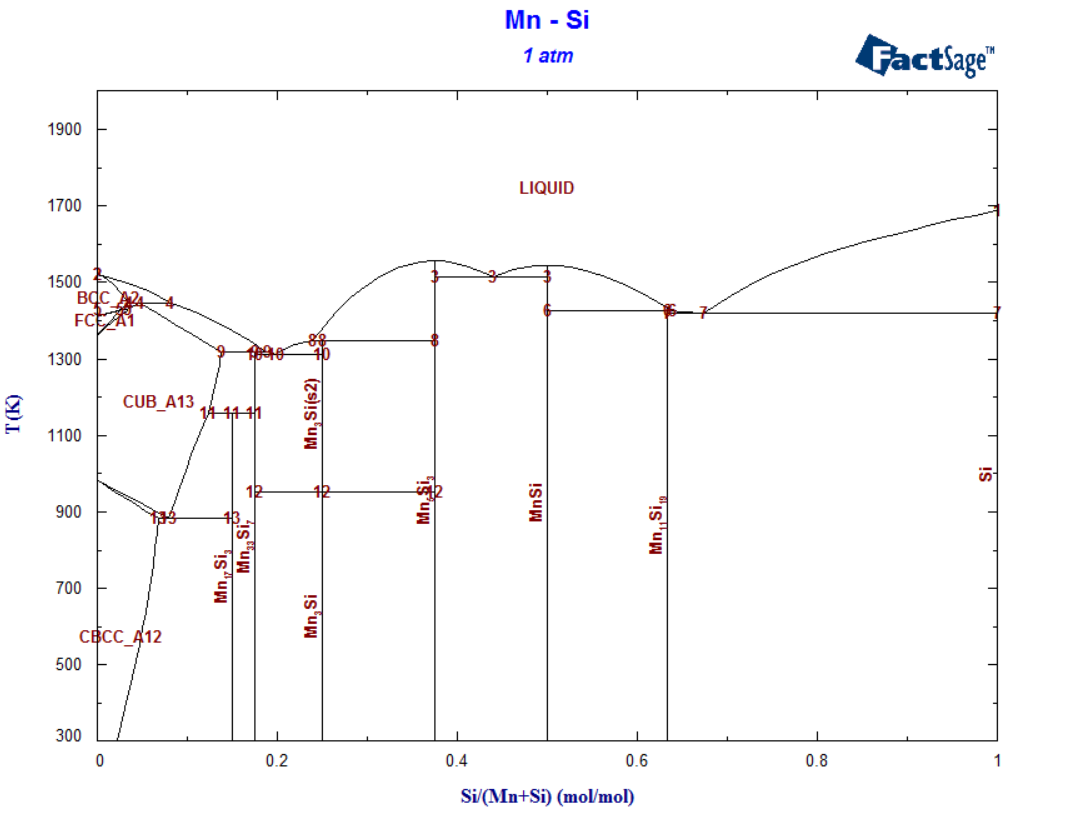
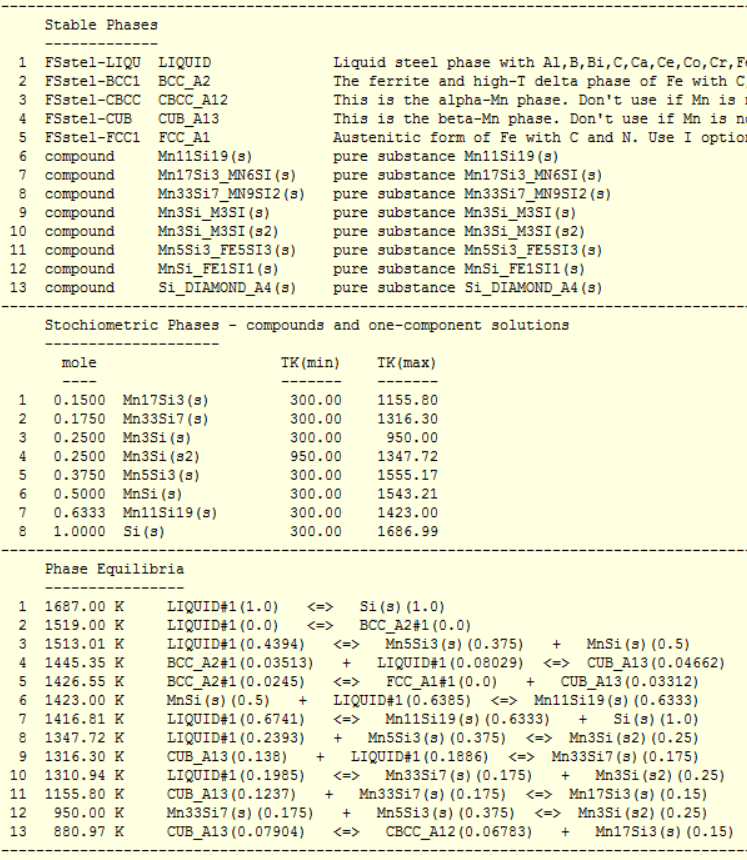
These options apply to the labels added manually - e.g. by pointing and clicking. - phase equilibria - displays the isothermal phase equilibria.
This option is limited to binary T vs X diagrams. - auto labels - automatically labels the diagram.
This option is limited to binary T vs X diagrams and polythermal projections. - previous - formerly labels - old
When loading a previously stored system, you can show the figure calculated last time. The program displays the calculated phase diagram including any labels that have been added manually. These labels are now stored in memory. If you return to the Menu Window, make changes to the phase selections, axes limits, etc. and recalculate the diagram, the new figure will not have any labels. By clicking labels - old the labels that were stored in memory are posted. - delete - deletes a label that has been manually entered (by pointing and clicking).
The label is selected from the combo box.
|
|
|
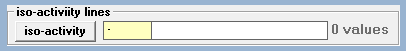
- iso-activity - calculates and plots iso-activity lines
The values are specified in the text box.
This option requires an 'iso-activity species' (i.e. option Z) to be specified in the Selection Window before the diagram is calculated.
|
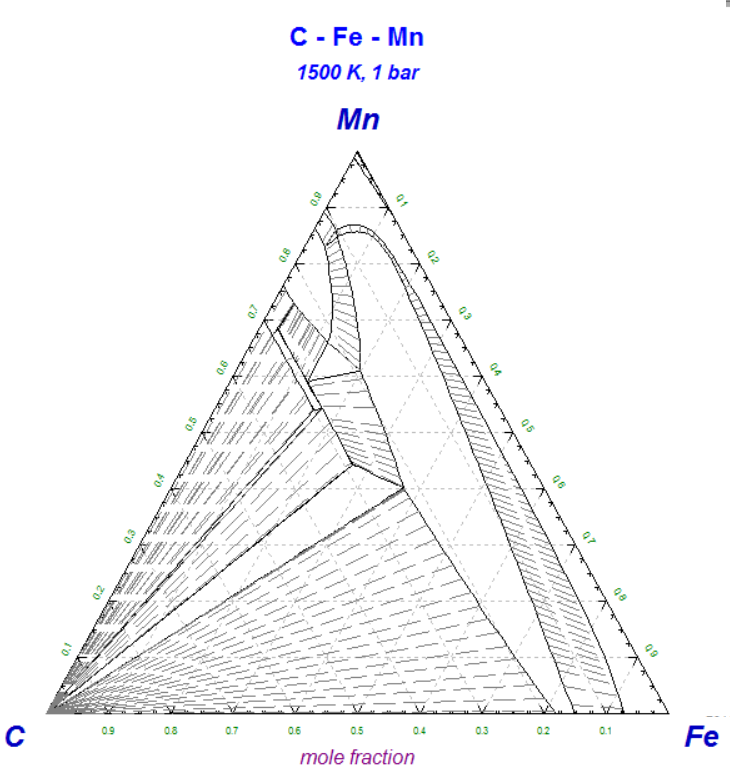
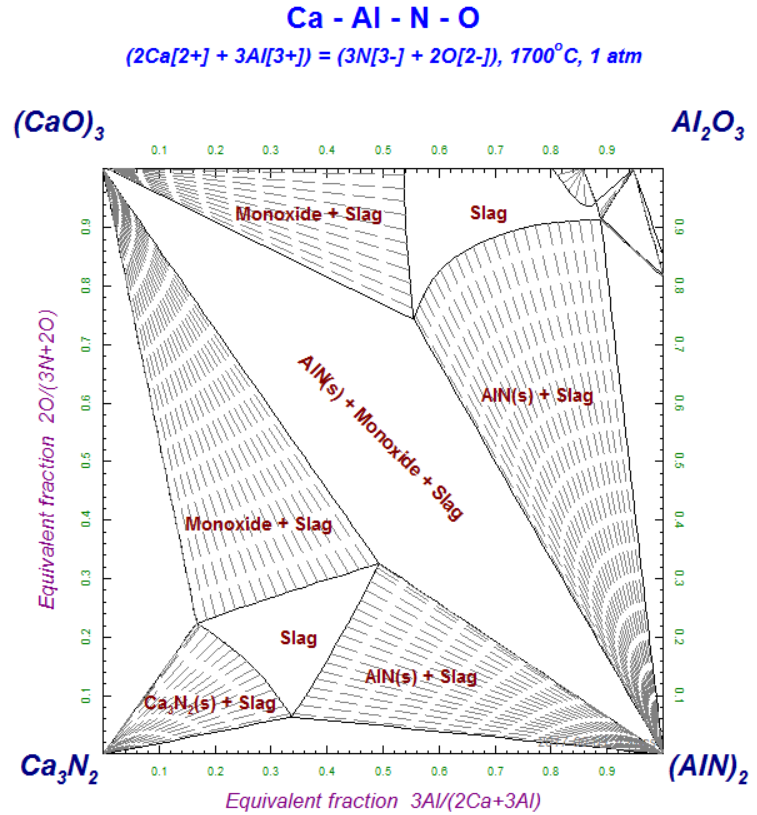
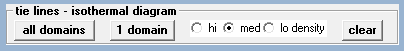
These options only apply to ternary or reciprocal isothermal section.
|
|
- all domains - attempts to plot the tie lines for all the two-phase regions.
Note: - for some domains the tie lines will be missing. In such a case select a 'single domain' (see next). - single domain - plots the tie lines for a particular two-phase region.
Simply point and click on the domain.hi med low - sets tie line densities (low, medium or high).
- clear - removes all the tie lines.
|
These options only apply to a ternary or reciprocal isothermal section.
|
|
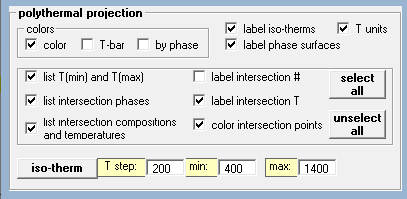
- colors
- 'color' plots in color or B/W.
- 'T-bar' displays the temperature bar. The colors correspond to the iso-thermal sections.
- 'by phase' - the colors correspond to a particular phase (and not an iso-therm).
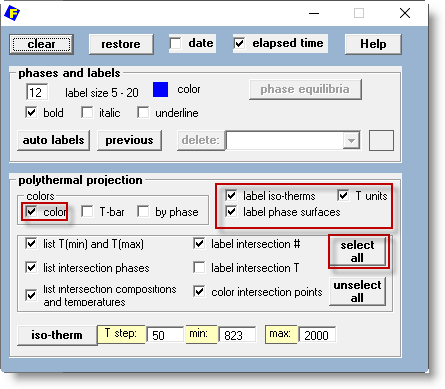
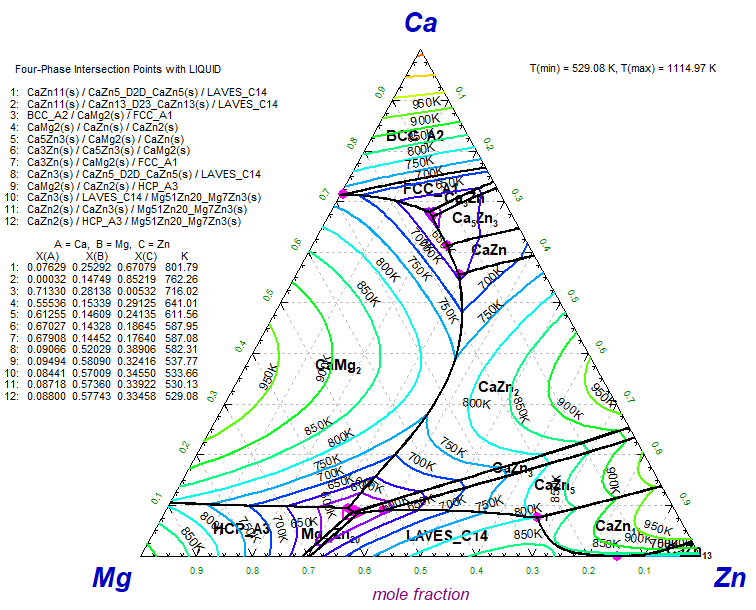
- label iso-therms - temperature label for each iso-thermal line.
- 'T units' of K or oC.
The temperature labels (together with the optional units K or oC) are aligned with the isothermal lines and displaced slightly to improve readabilty. - label phase surfaces - the domains of the liquidus surfaces are automaticaly labeled.
- list T(min) and T(max), list intersecion phases, list intersection compositions and temperatures,
label intersection #, label intersection T, color intersection points
- offer a variety of display options to enhance the diagram.
- select all or unselect all - to applies or clears the previous display options.
- iso-therm - calculates plots iso-thermal lines on the diagram.
The step in T is defined in the text box.
|
These options only apply to polythermal projections.
|
|
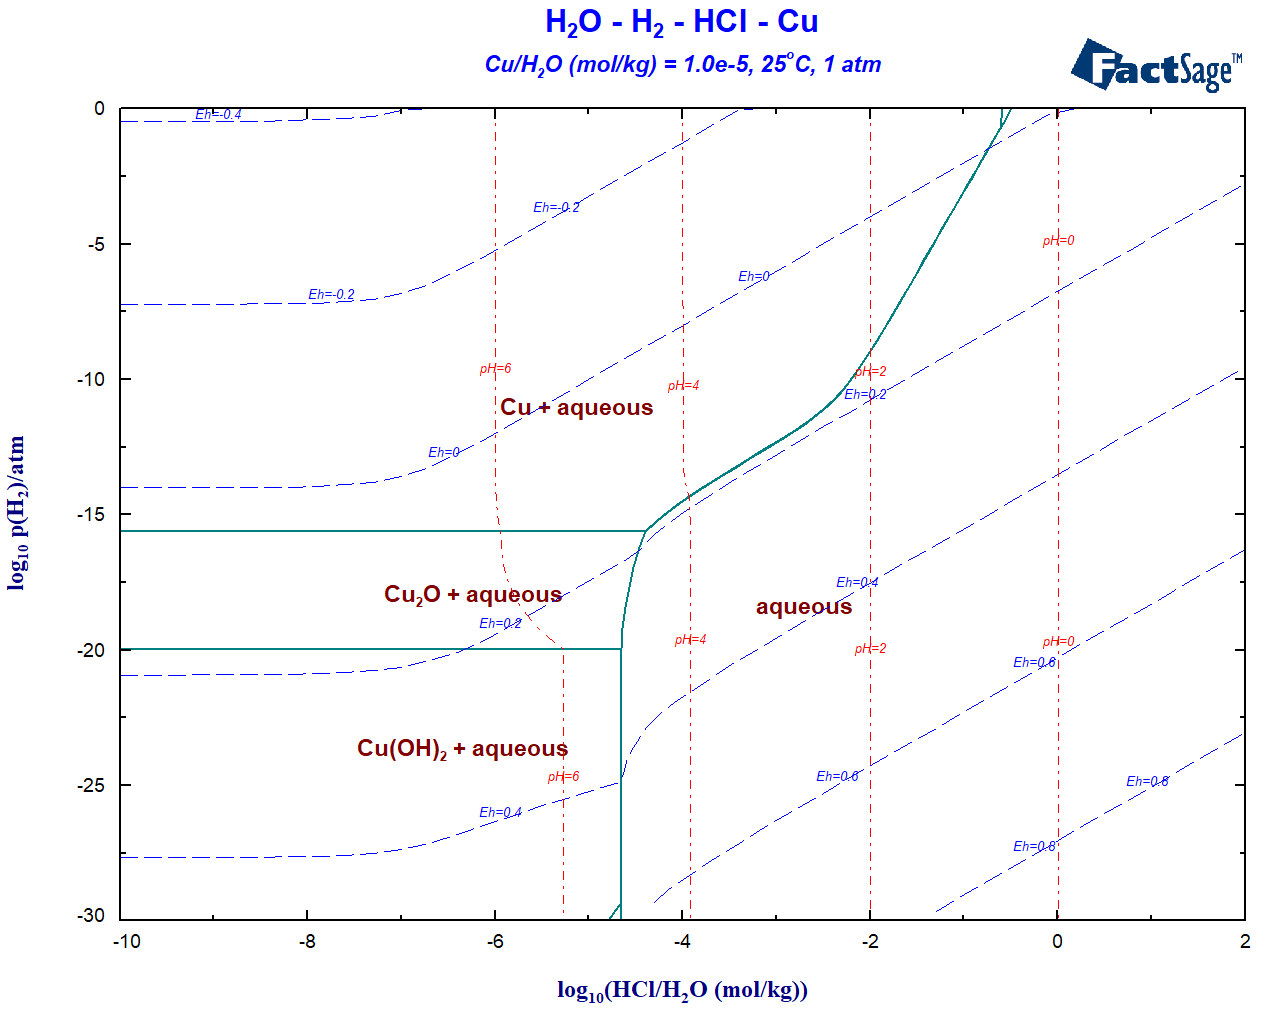
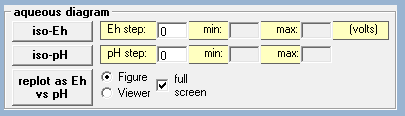
- iso-Eh - plots iso-Eh(volts) on the aqueous diagrams.
The step in Eh, and the limits min. and max. are defined in the text boxes.
- iso-pH - plots iso-pH lines on the aqueous diagrams.
The step in pH, and the limits min. and max. are defined in the text boxes.
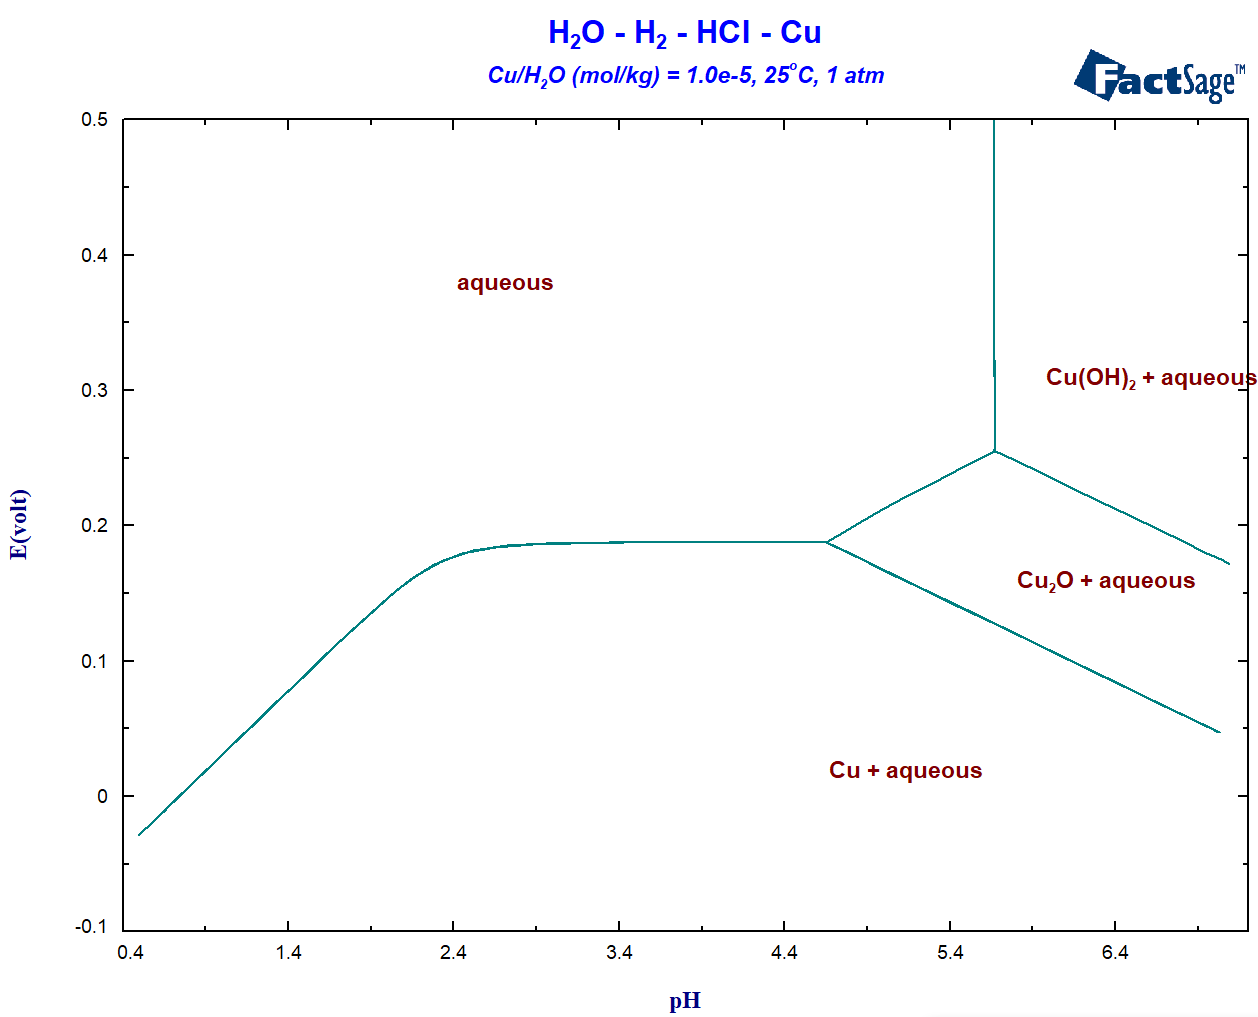
- replot as Eh vs pH - transforms the calculated aqueous diagram to Eh vs pH axes.
The resulting diagram is a true Eh-pH phase diagram.
|
These options only apply to aqueous diagrams.
|
|
'Manipulate and Refresh Window' - options 'labels', 'equilibria' and 'iso-activity'