1. General:
|
Important! After installation you should periodically check the latest news about FactSage 7.2 where we immediately report any 'bugs' and other issues as they surface - www.FactSage.com > 'FactSage 7.2 ~ News ~' |
FactSage 7.2 ~ News ~ |
The 'bugs' and other issues highlighted in the previous 'FactSage 7.1 ~ News ~' have been resolved.
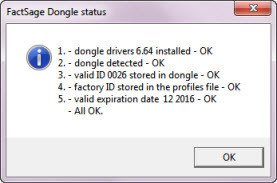
FactSage dongle status
- When a valid HASP dongle is attached to a USB port on the computer you are able to run a standalone version
of FactSage.
If FactSage issues an error message about a 'missing or invalid FactSage HASP security key'
it goes into the FactSage SetUp mode with a green screen.
There are several factors that can cause this to happen.
The 'FactSage dongle status' Window shown here is for an installation where a valid FactSage dongle
is attached and everything is in order (i.e. 1 - 5. All OK).
You can update/refresh a FactSage Standalone computer or a Network
Server. In the case of a network installation it is
only necessary to update/refresh the Network Server.
Do not update a FactSage 6.4 installation -
in this case select 'New FactSage installation' and install FactSage 7.2 in a new folder.
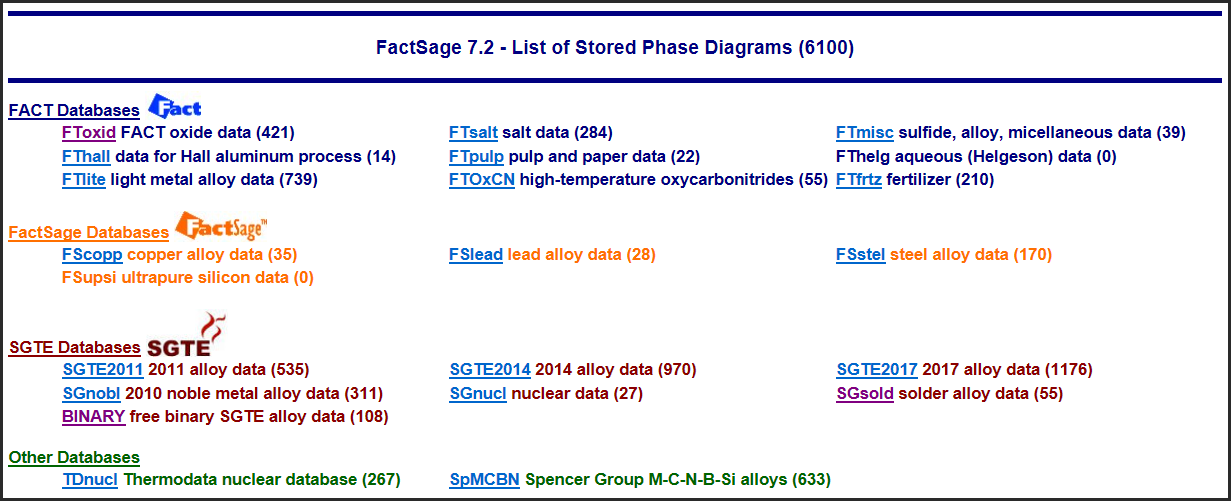
The total number of stored phase diagrams has been increased by approx. 1,200.
Equilib and Phase Diagram engage the ChemApp Gibbs energy minimizer which is programmed in FORTRAN.
In FactSage 7.2 we have changed the FORTRAN complier.
We now employ the Intel Compiler which produces optimized code that is more compact and runs significantly faster.
In addition the superior error checking features of the new compiler enable us to produce a code
that is less likely to contain bugs.
In the future we plan on employing the parallel processing options available in the Intel Compiler.
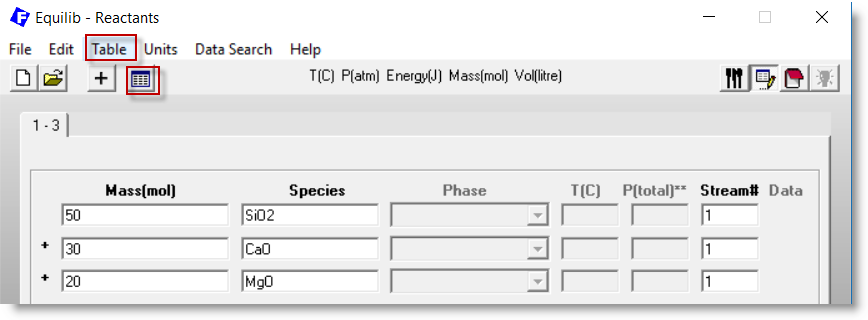
In the Equilib Reactants Window you specify a set of reactant
amounts, for example:
50 mol SiO2 + 30 mol CaO + 20 mol MgO
But you may open a Reaction Table and specify multiple sets of reactant amounts.
With the Reaction Table you specify various sets of
reactant amounts as well as their product temperatures and
pressures - each set resulting in a separate equilibrium calculation.
Here the Reaction Table shows the entry 5 separate equilibrium calculations (rows 1 - 5).
As new amounts are entered the totals are updated.
For example, with the entry of 40 mole MgO on row 5 the display updates the total:
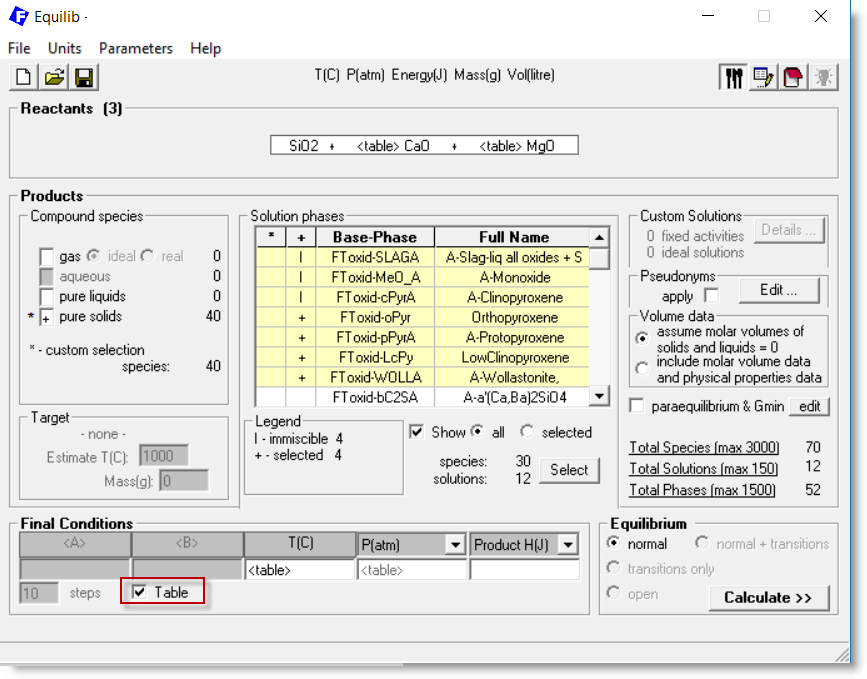
After closing the Reaction Table you open the Menu Window and select the Table option.
This causes the original amounts and Final Conditions to be replaced by <table> .
The product equilibrium is calculated in the usual manner (click on Calculate >>)
and 5 pages of output are displayed in the Results Window
1 - The Table option is selected in the Menu Window
In general the Reaction Table is used to specify sets of input amounts with
their product temperature and pressure.
In FactSage 7.2 it may be possible to change the type of calculation,
for example ignore the product temperature,
but still employ the Reaction Table to define the input amounts.
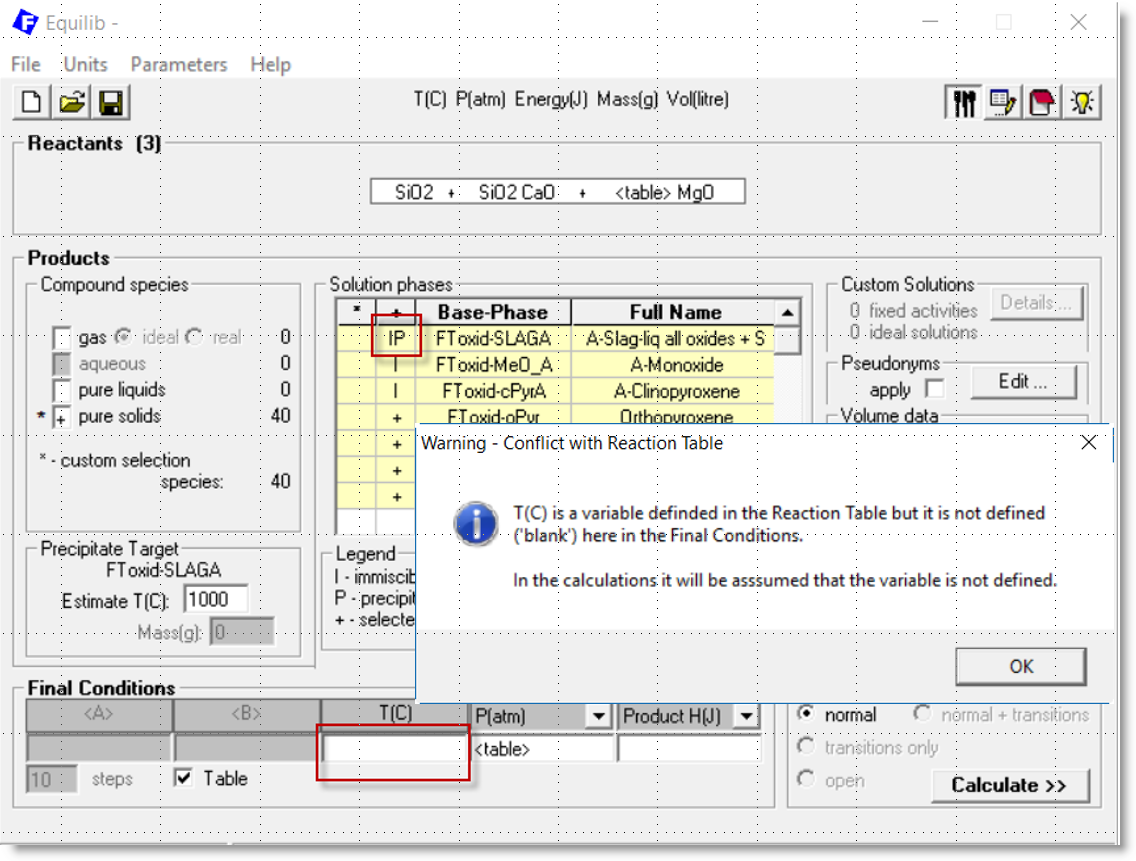
For example, in the above case the initial temperature of precipitation of solids
from the slag phase could be calculated
by specifying FToxid-Slag as a precipitate target phase (option 'P')
and not specifying the final temperature ('blank').
This causes a conflict with the Reaction Table where the final temperature is defined.
The Warning - Conflict with Reaction Table is posted in the Menu Window
as shown in the following screenshot.
But in FactSage 7.2 the calculation is now permitted
and the temperature specified in the Reaction Table is ignored.
1 - In the Menu Window option 'P' is applied to FToxid-Slag and the final temperature is undefined ('blank')
These values will appear at the top of the page in the Equilib Results Window.
In the case of a range of values with multiple output pages
(e.g. T = 1000, 1100, 1200, ...)
the elapsed time for the first page (T = 1000) will tend to be slightly longer than the others
since it also includes the time to load the data from the databases.
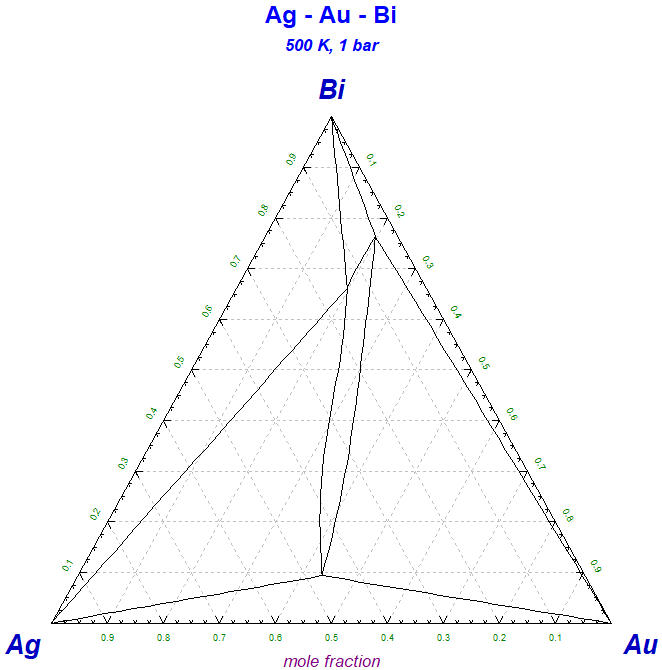
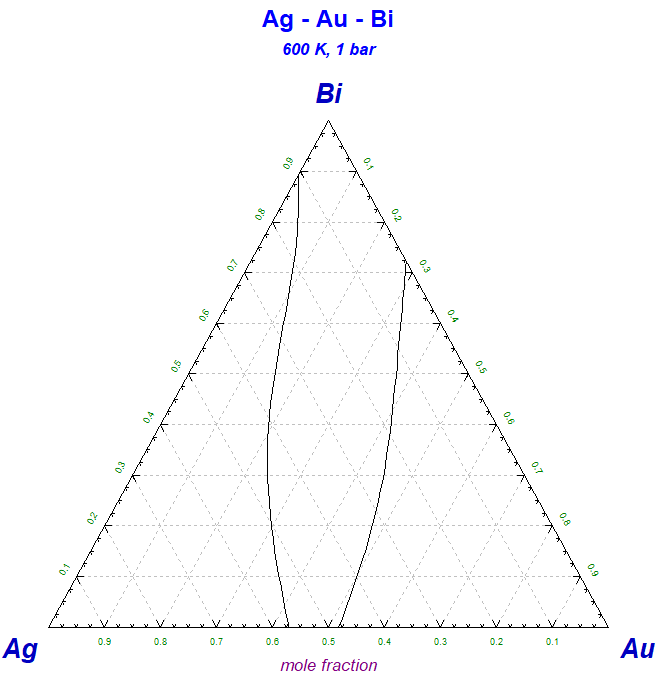
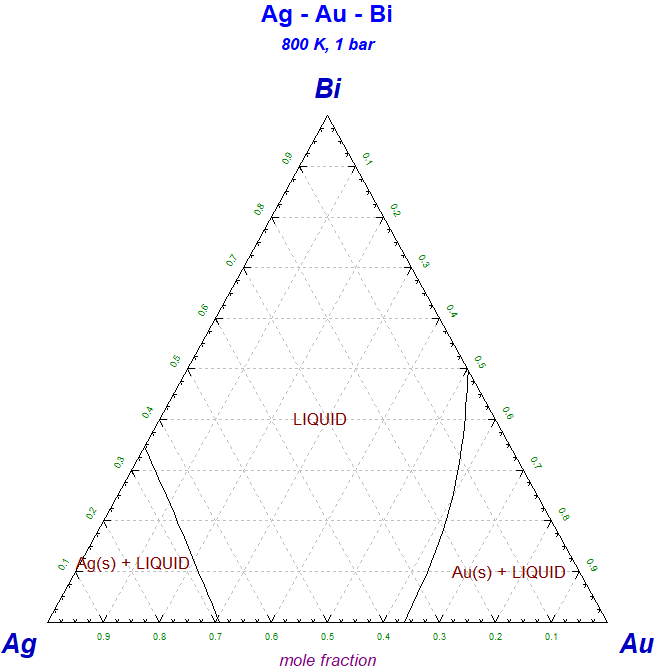
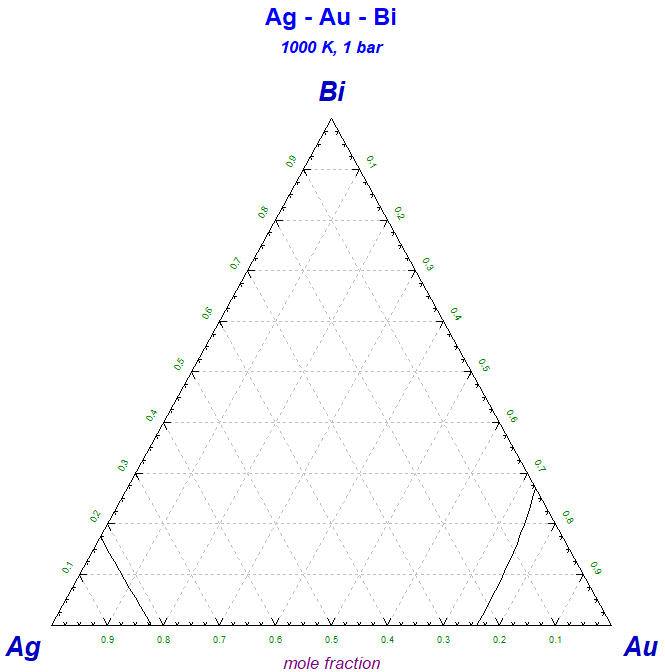
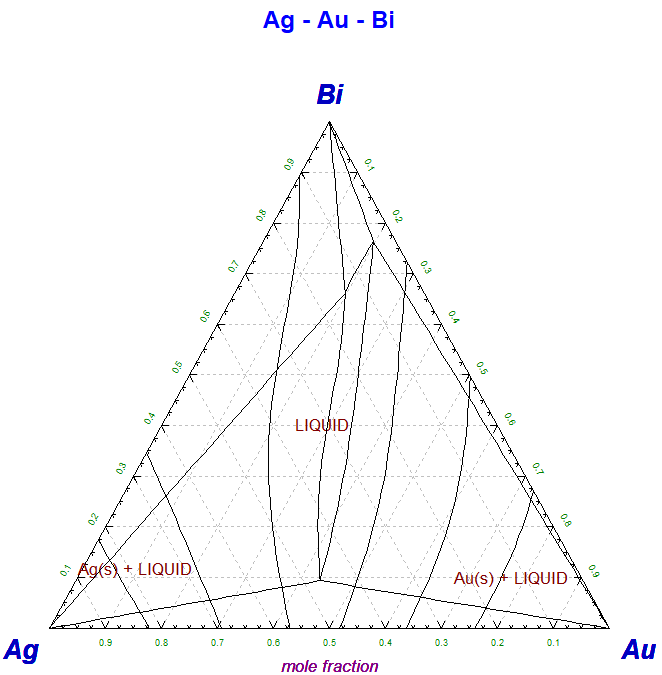
This Phase Diagram macro is particularly useful if you wish to superimpose several calculated phase diagrams into one figure.
.
Copy PhasEx_Superimpose_Figs.mac to the folder that contains the *.fig files of the type MyName-1.fig, MyName-2.fig, MyName-3.fig ...
Run 'Phase Diagram' and then 'Phase Diagram - Components Window > File > Macro Processing > Run .... PhasEx_Superimpose_Figs.mac'.
The macro:
The screenshot shows four Ag-Au-Bi isothermal sections superimposed into one figure.
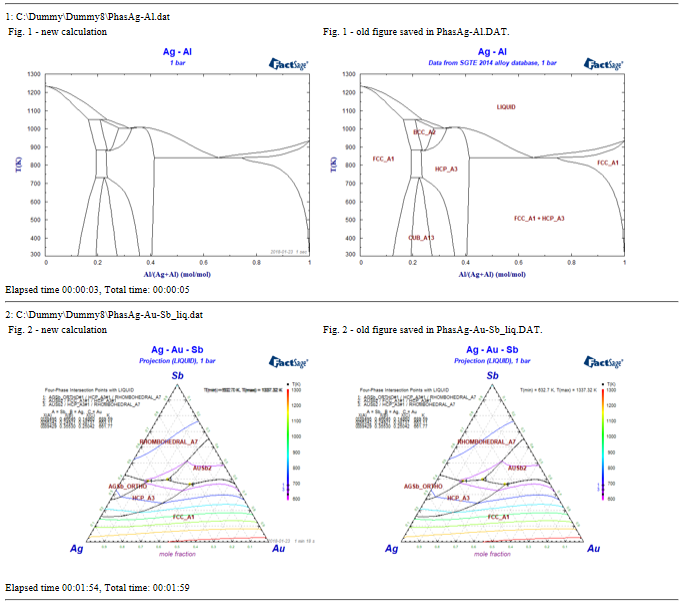
This Phase Diagram macro is particularly useful for database developers who wish to recalculate phase diagrams using revised databases.
The macro loads each Phas*.dat that is stored in a folder, calculates the phase diagram and then displays the calculated figures in a web browser (htm) format.
If the Phas*.dat contains a stored diagram it is displayed as well.
In this manner the developer can compare the newly calculated diagram with the old one.
Copy PhasEx_Calc_All_PDs.mac to the folder where the Phas*.dat files are stored. Run 'Phase Diagram' and then 'Phase Diagram - Components Window > File > Macro Processing > Run .... PhasEx_Calc_All_PDs.MAC'.
The macro:
In order to permanently save a record of all calculated and saved figures use 'Word' to open Phas_Calc_All_PDS.htm and save as a *.pdf file - for example Phas_Calc_All_PDS.pdf.
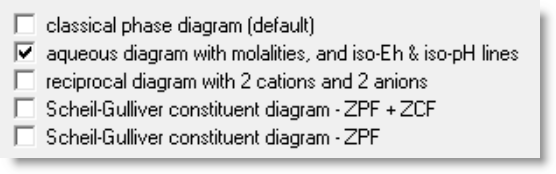
The various types of phase diagrams have been reorganized.
Classical phase diagram
When a diagram is not in any of the other categories it is designated as classical.
This is the default setting.
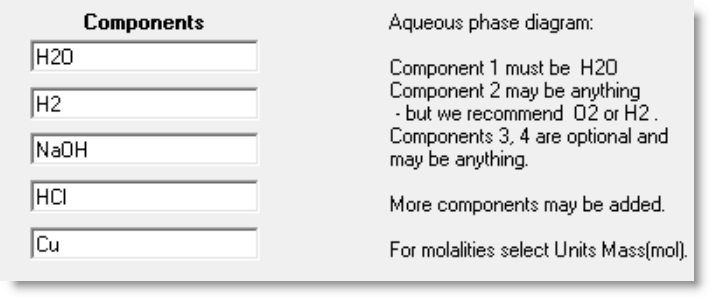
Details on Aqueous Phase Diagrams are given in the Phase Diagram
Slide Show (slides 19.1 - 19.37).
With an aqueous diagram you have the option to plot iso-Eh and iso-pH lines.
In addition, you can transform the calculated diagram to Eh, pH coordinates - see below.
For an aqueous diagram you must specify H2O as the firat component.
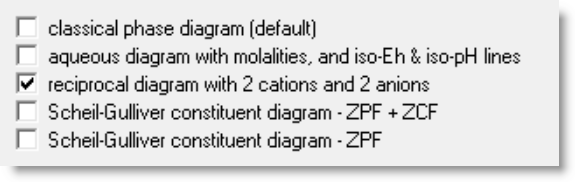
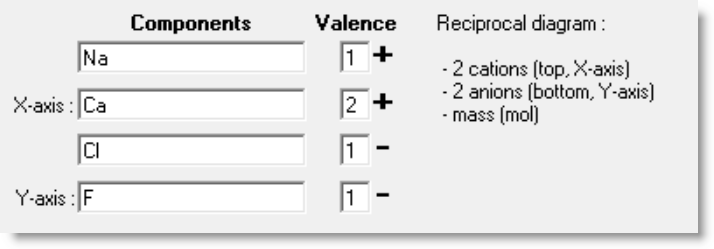
Details on Reciprocal Phase Diagrams are given in the Phase Diagram
Slide Show (slides 14.1 - 14.7).
NaCl-CaCl2-NaF-CaF2 is a reciprocal salt system because the chemistry can be defined by the
following exchange reaction:
The ionic components are Na[+], Ca[++], F[-], and Cl[-] and must be defined as shown.
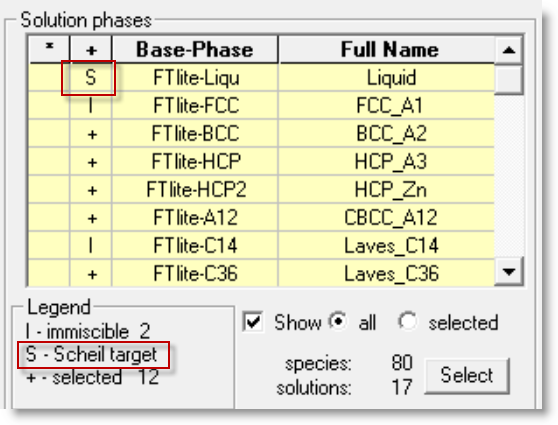
Details on Scheil-Gulliver Constituent Diagrams are given in the
Phase Diagram Slide Show (slides 18.1 - 18.20).
For Scheil-Gulliver diagram you must select the 'Scheil' target solution phase.
All the diagrams described above are included in the approximately 70 example diagrams with various X- and Y-axes.
To display a summary (htm format) of all these diagrams
click on 'Phase Diagram > Components Window > Help > Phase Diagrams with various ...'.
To load and calculate the various phase diagrams
click on 'Phase Diagram > Components Window > File > Directories > Phase diagrams with various ...'.
This list of examples is by no means exhaustive.
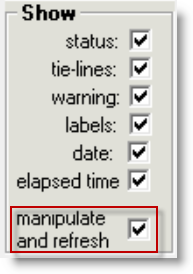
2. Phase Diagram Manipulate and Refresh Window
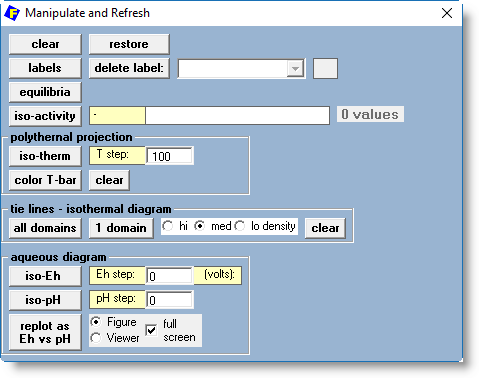
The Phase Diagram Manipulate and Refresh Window offers various tools to manipulate or refresh
a calculated phase diagram.
The screenshot shows how to activate the Manipulate and Refresh Window via the Parameters Window
('Phase Diagram > Menu Window > Parameters')
The Phase Diagram Manipulate and Refresh Window offers a variety of editing and plotting options depending upon the type of calculated phase diagram.
The new window is displayed right after the phase diagram has been calculated.
The Window offers 4 categories for manipulating the calculated phase diagram:
These options only apply to a ternary or reciprocal isothermal section.
2.1 'Refresh Window' - options 'labels', 'equilibria' and 'iso-activity'
1 - Cu-O binary T(C) versus X phase diagram
2.2 'Refresh Window' - option 'tie lines'
1 - Isothermal C-Fe-Mn isothermal section at 1500K - data from SGTE 2014
1 - Isothermal reciprocal Ca-Al-N-O section at 1700 C - data from FTOxCN
2.3 'Refresh Window' - options 'labels' and 'equilibria'
1 - Mn-Si binary T(C) versus X phase diagram after options 'labels' and 'equilibria' - data from FSstel
2.4 'Refresh Window' - aqueous diagram option 'replot as Eh vs pH'
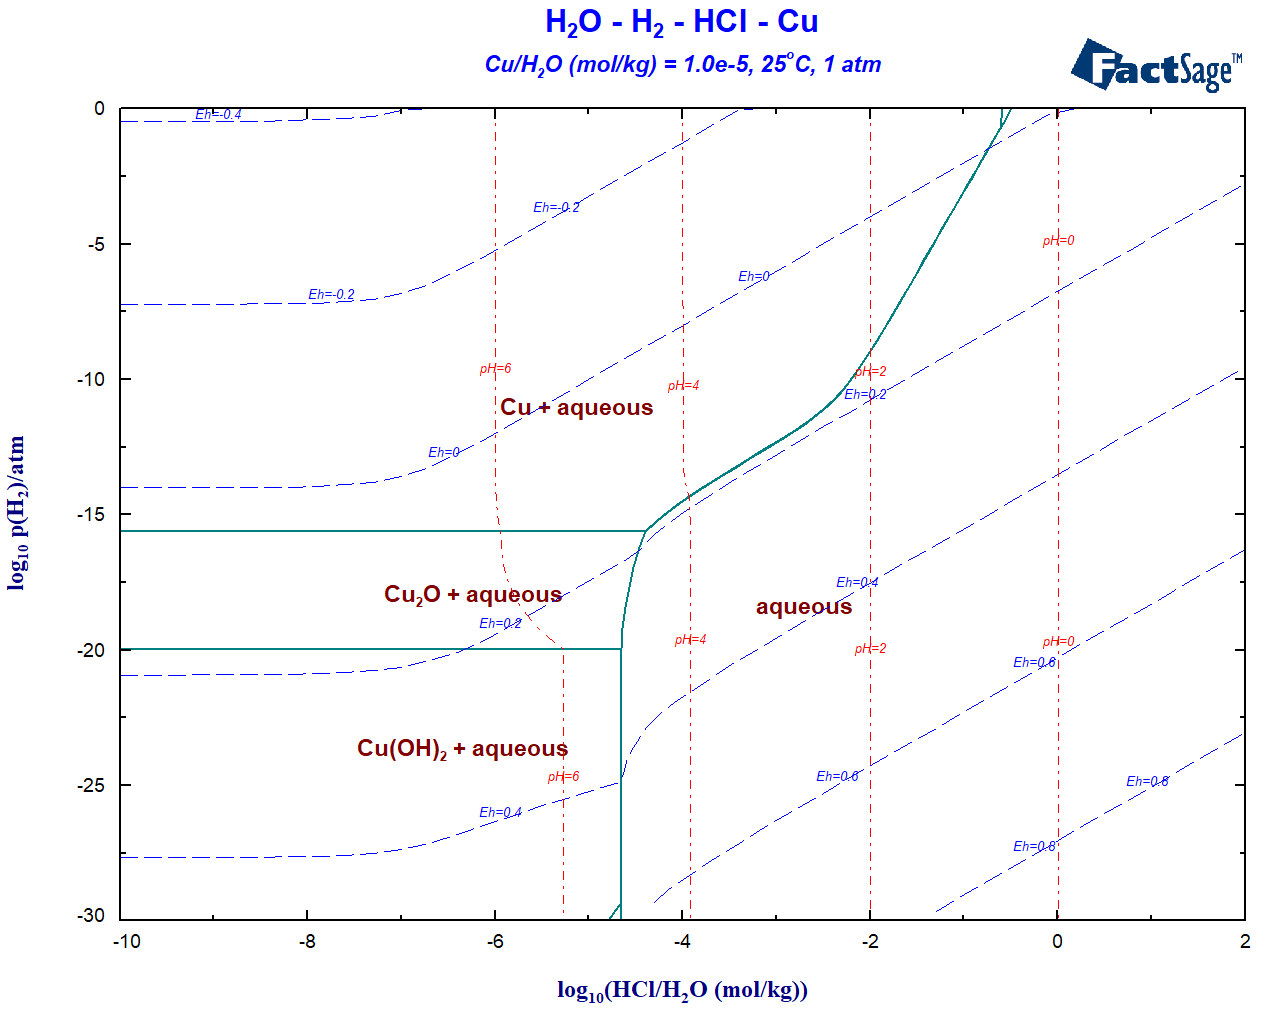
1 - log10(p2) vs log10(pHCl/pH2O) aqueous H2O-H2-HCl-Cu phase diagram at m(Cu)=1e-5, 25oC
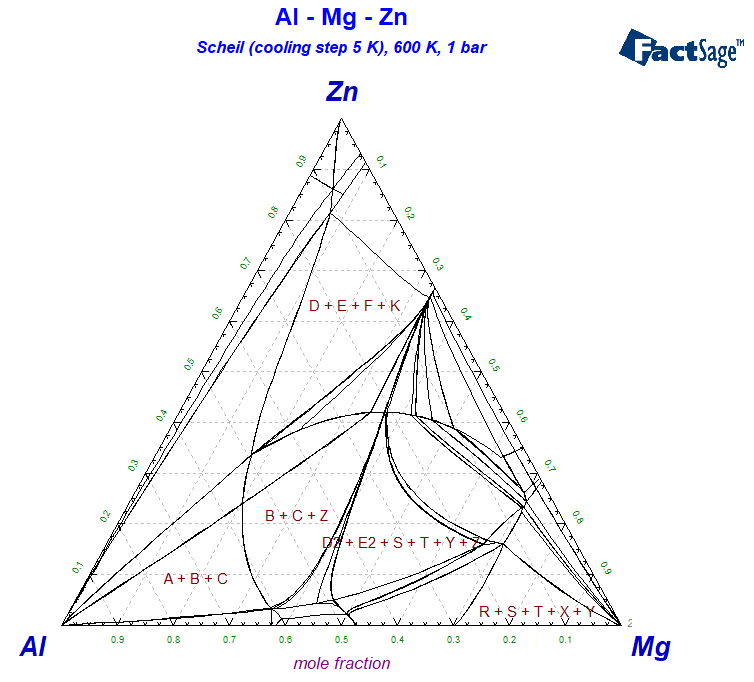
The Scheil-Gulliver Constituent Diagram is a new type of phase diagram (first presented in
FactSage 7.1) that we have developed for displaying the cooling path when a system is cooled and
the constituents in the phases are not allowed to diffuse
The algorithm has been expanded and improved such that FactSage is able to calculate the diagrams
more efficiently.
1 - Calculated Scheil-Gulliver constituent diagram for the Al-Mg-Zn system - data from FTlite
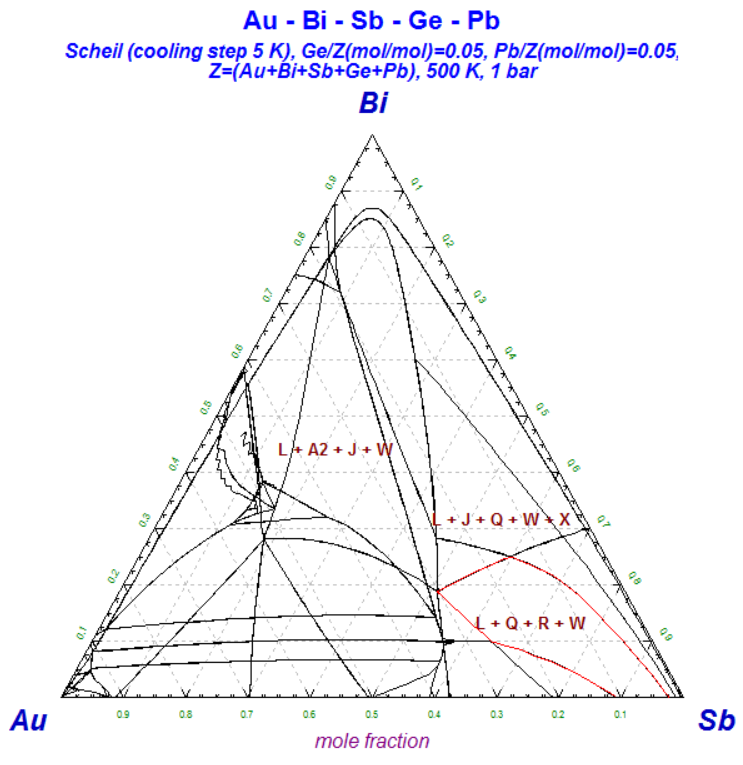
1 - Calculated Scheil-Gulliver constituent diagram for the Au-Bi-Sb-Ge-Pb system - data from FTlite
In the FactSage Main Menu click on 'Documentation' for detailed information on the public compound and solution databases.
PbBr4 and Cu(OH)2
SrO has been added to the database. The whole
SrO-BaO-Al2O3-B2O3-CaO-MgO-SiO2 system has been optimized, including 27
solid solutions and numerous stoichiometric compounds.
Bredigite Ca3(Ca,Mg)4Mg(SiO4)4 solid solution has been added to the
CaO-MgO-SiO2 system.
Approx. 50 new FToxid phase diagrams have added to the 'list of stored phase diagrams'.
There are now 421 phase diagrams (was 372 in FactSage 7.1)
including 132 (113) binary systems and 289 (259) ternary systems.
The 79 elements included in the database are,
From among these elements, there are some 603 completely assessed binary alloy systems,
of which 15 are newly assessed systems and
28 others have been revised or amended on the basis of newly published experimental information.
The database also includes about 141 ternary and 20 higher-order systems for which assessed
parameters are available for phases of practical relevance.
The systems now incorporate 318 different solution phases and 1227 compound phases
(mainly stoichiometric intermetallics).
Complete details on SGTE(2017) are given in 'Documentation'
in the FactSage Main Menu.
B-Fe B-Si Hf-N
B-Re B-Tc B-Y C-Re C-Sc C-Tc Co-Hf Co-Sc Co-Ti Cr-Hf Cr-Re Cr-Sc Cr-Y
Fe-Hf Hf-Re Hf-Y Mo-Re Mo-Sc Mo-Tc Mo-Y N-Y Nb-Re Nb-Sc Nb-Y Ni-Re Ni-Sc Ni-Tc
Re-Sc Re-Si Re-Tc Re-Ti Re-V Re-Y Re-Zr Sc-Si Sc-Ta Sc-Ti Sc-W Ta-Y
Tc-Ti Tc-W Ti-Y V-Y W-Y
Al-B-C Al-B-Co Al-B-Cr Al-B-Fe Al-B-Mo Al-B-N Al-B-Nb Al-B-Ni
Al-B-Re Al-B-Ti Al-B-V Al-B-Zr Al-C-Co Al-C-Cr Al-C-Fe Al-C-Hf
Al-C-Mo Al-C-Nb Al-C-Ni Al-C-Sc Al-C-Ta Al-C-Ti Al-C-V Al-C-W
Al-C-Zr Al-Cr-N Al-Hf-N Al-Mo-N Al-N-Nb Al-N-Ni Al-N-Si Al-N-Ta
Al-N-Ti Al-N-V Al-N-W Al-N-Zr
What's New in:
What's New in:
This new feature was first introduced in FactSage 7.0 and remains unchanged.
It displays the status of the FactSage dongle attached to the computer.
This helps you to diagnose the source of the error message.
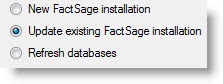
The FactSage 7.2 Installation program enables you to update/refresh FactSage 7.2 software,
documentation and databases to the full FactSage 7.2 package.
You can update a FactSage 7.0 or 7.1 installation.
2. Modules:
.
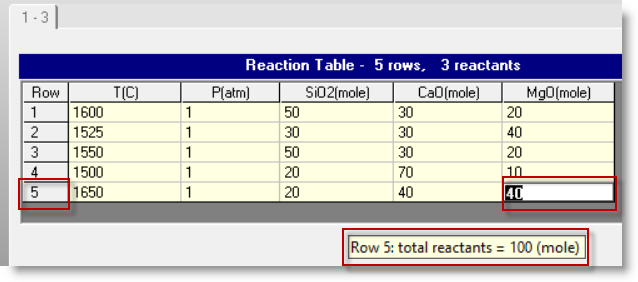
Row 5: the total reactants = 100 (mole)
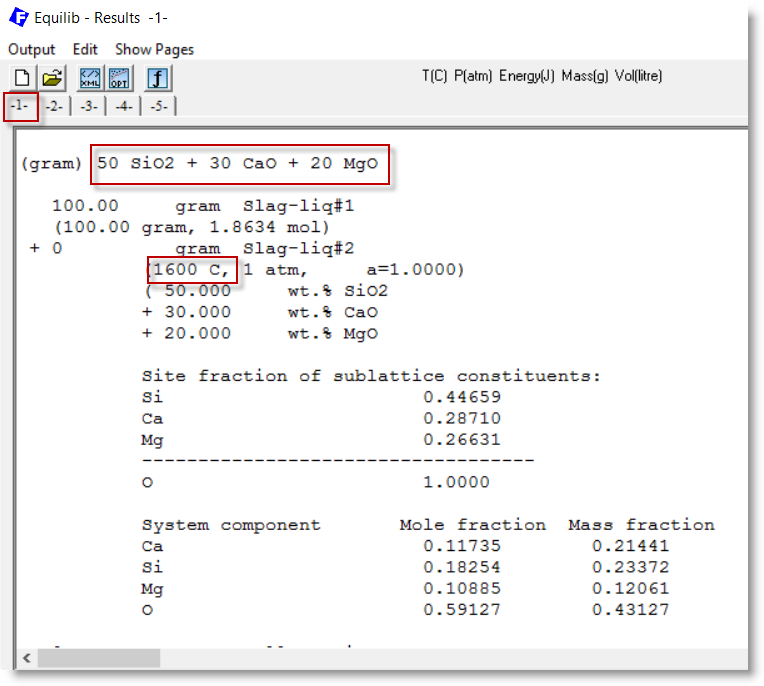
2 - Results Window showing the equilibrium calculation for the first set of reactants
- row 1 in the Reaction Table.
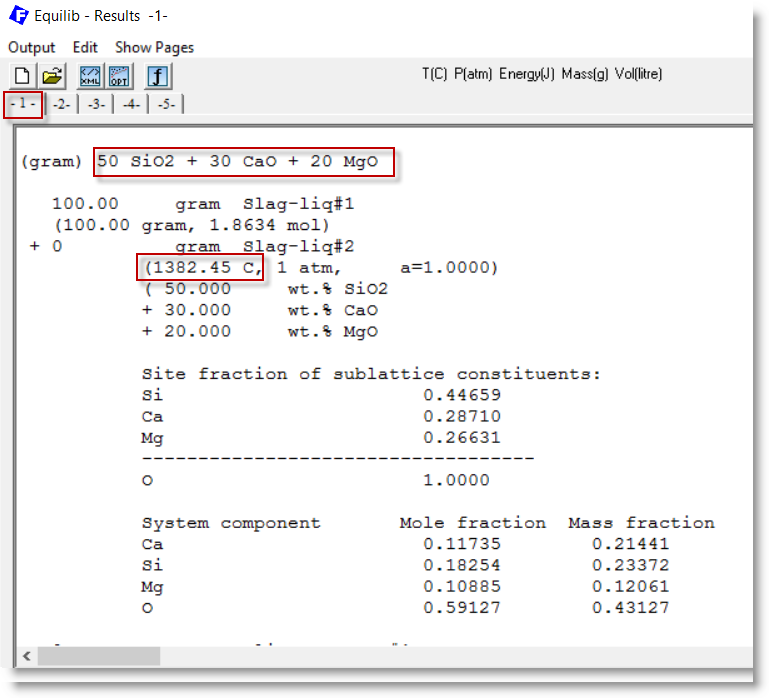
2 - In the Results Window the precipitate temperature for page 1 is 1382.45 C
.
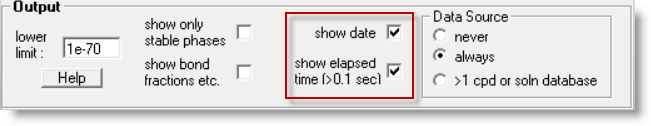
In the Equilib Parameters Window the show options in the Output Frame have been enhanced.
After the equilibrium has been calculated, you can now display
the date and elapsed time (if more than 0.1 sec) for the calculation.
.
PhasEx_Superimpose_Figs.mac is a new macro file in FactSage 7.2.
.
PhasEx_Calc_All_PDs.mac is a new macro file in FactSage 7.2.
1. Phase Diagram Components Window
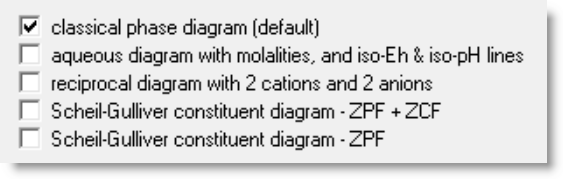
Aqueous diagram
Reciprocal diagram
2NaCl + CaF2 = 2NaF + CaCl2
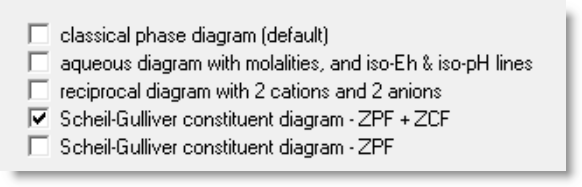
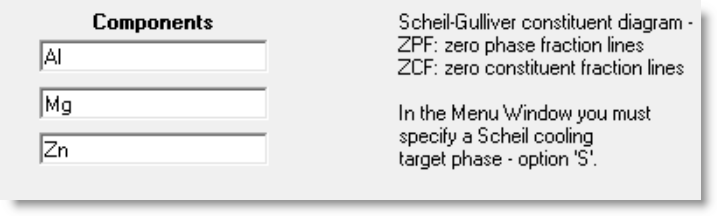
Scheil-Gulliver diagram
Note - when you display a stored phase diagram, e.g. show the figure calculated last time -
most of the categories are not available.
This option applies to all phase diagrams.
This option applies to all phase diagrams.
This option is limited to binary T vs X diagrams and polythermal projections.
Note: - some labels will be missing especially for solutions that have immiscibility (i.e. 2 domains with the same name)
The label is selected from the combo box.
This option is limited to binary T vs X diagrams.
The values are specified in the text box.
This option requires an 'iso-activity species' (i.e. option Z) to be specified in the Selection Window before the diagram is calculated..
These options only apply to polythermal projection diagrams.
The step in T is defined in the text box.
The colors correspond to the iso-thermal sections.
Click on clear to remove the color-T-bar.
Note: - for some domains the tie lines will be missing.
In such a case select a 'single domain' and then point and click on the domain.
These options only apply to aqueous diagrams.
The resulting diagram is a true Eh-pH phase diagram.
![]()
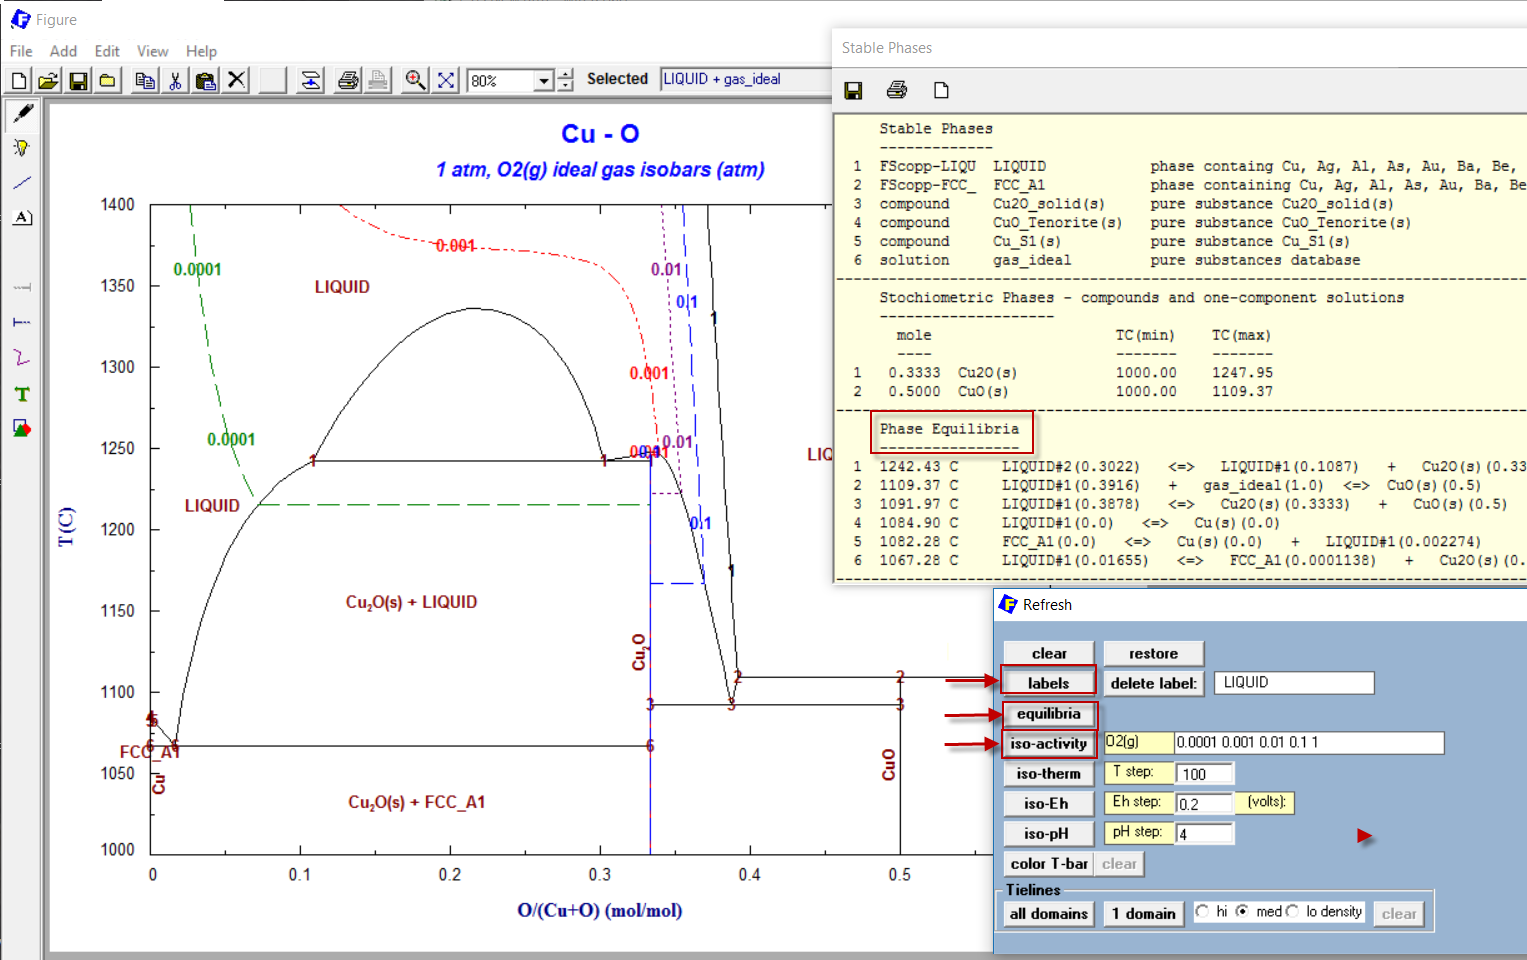
2 - Cu-O diagram after then selecting options 'labels', 'equilibria' and 'iso-activity' from the 'Refresh Window'
![]()
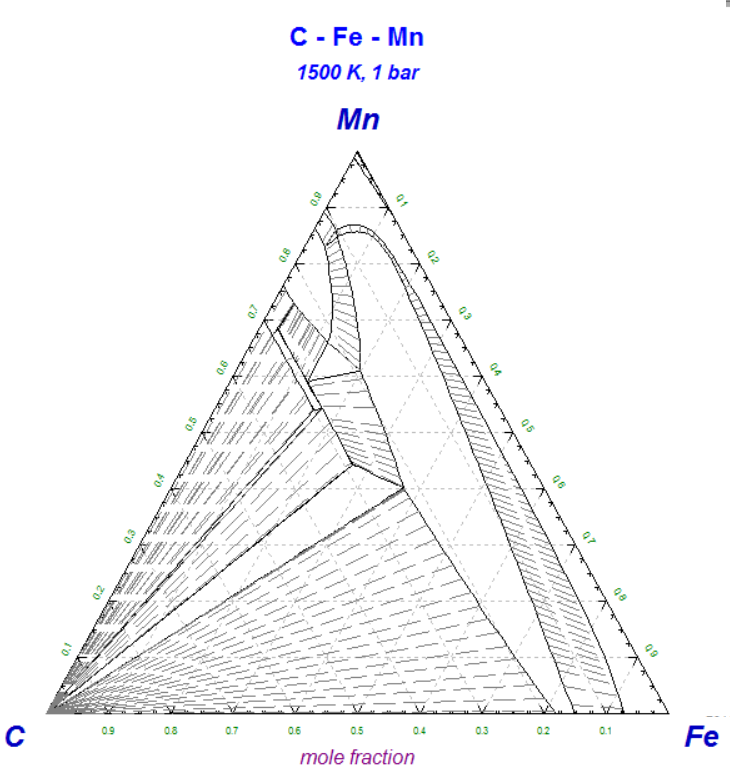
2 - C-Fe-Mn diagram after selecting option 'tie lines' from the 'Refresh Window'.
![]()
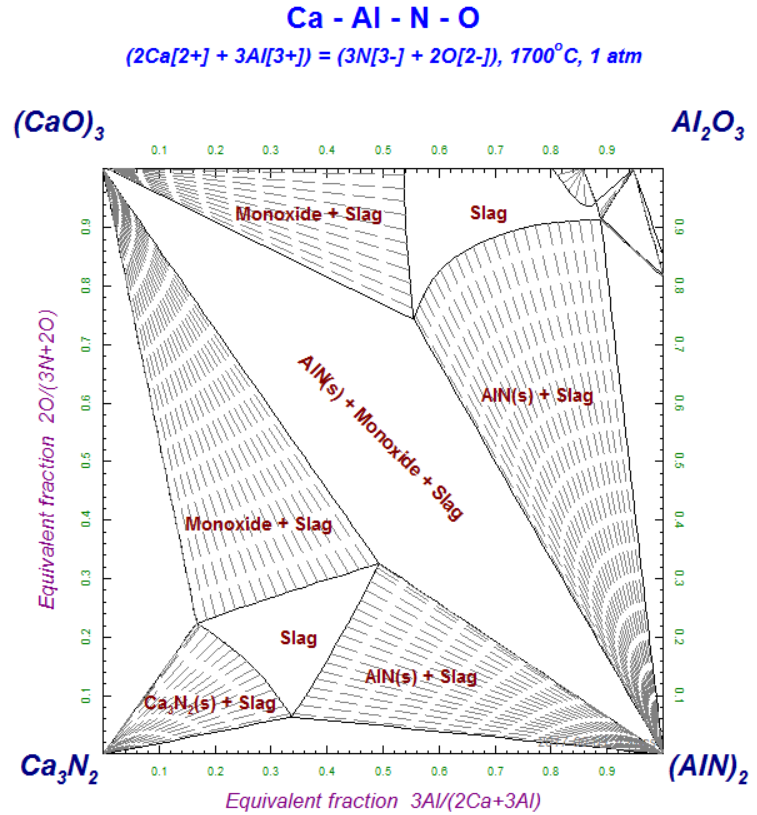
2 - Ca-Al-N-O diagram after labeling and selecting option 'tie lines' from the 'Refresh Window'.
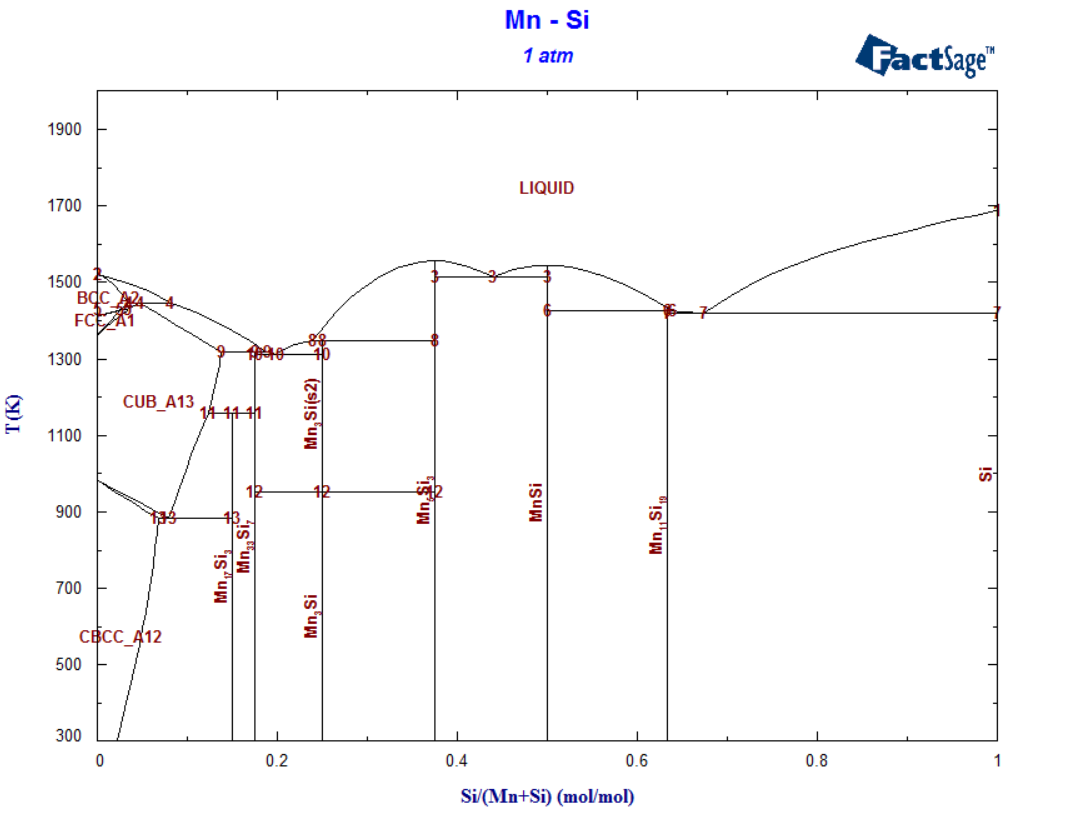
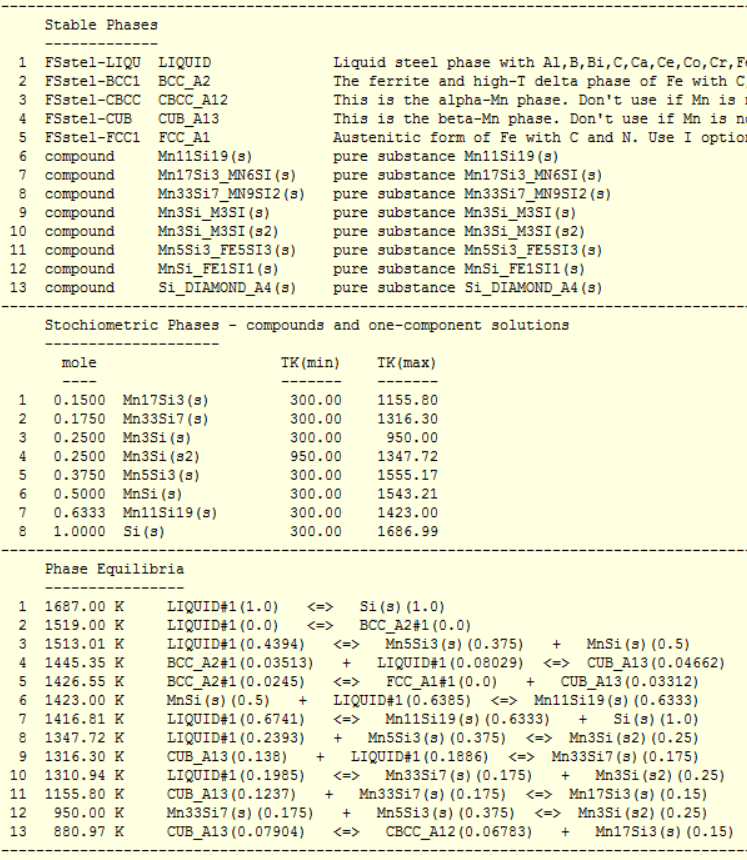
2 - list of phase equilibria in Mn-Si
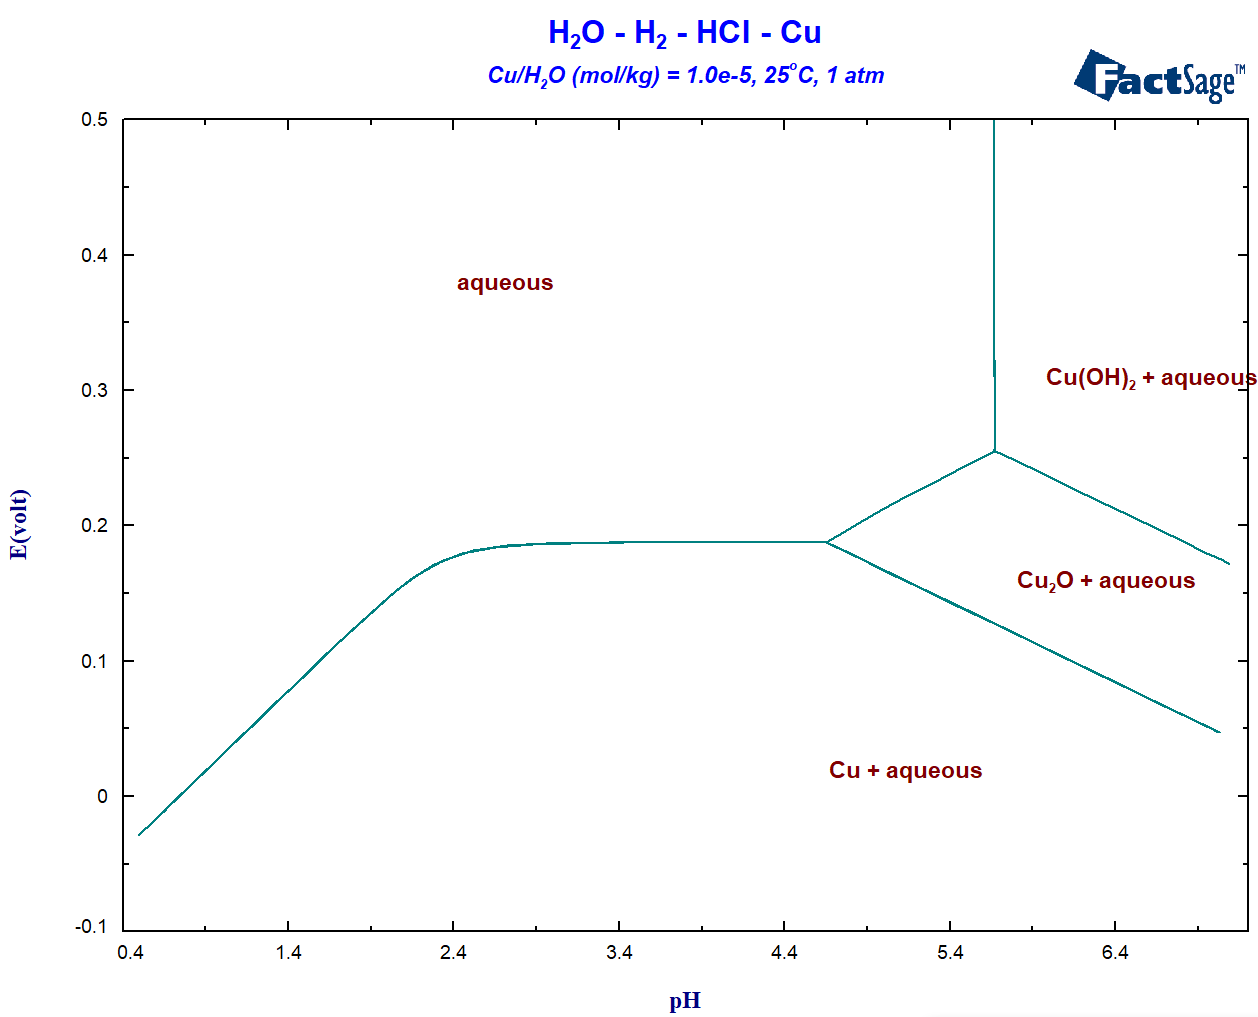
2 - replotted as true Eh-pH phase diagram
3. Multicomponent Scheil-Gulliver Constituent Diagrams
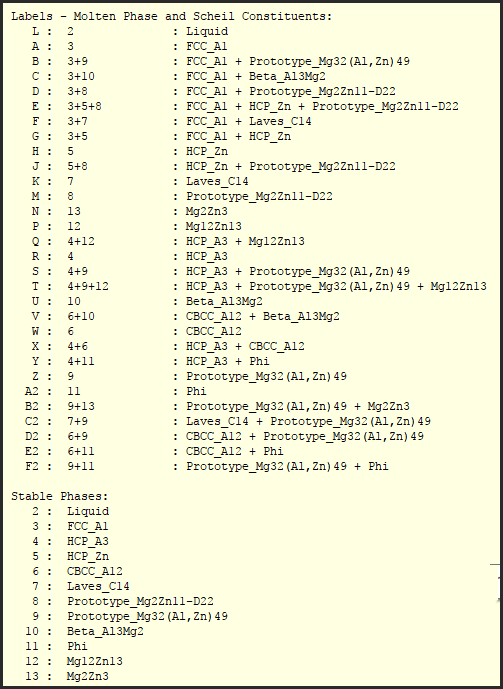
2 - List of the Scheil constituents and phases during Scheil cooling of Al-Mg-Zn
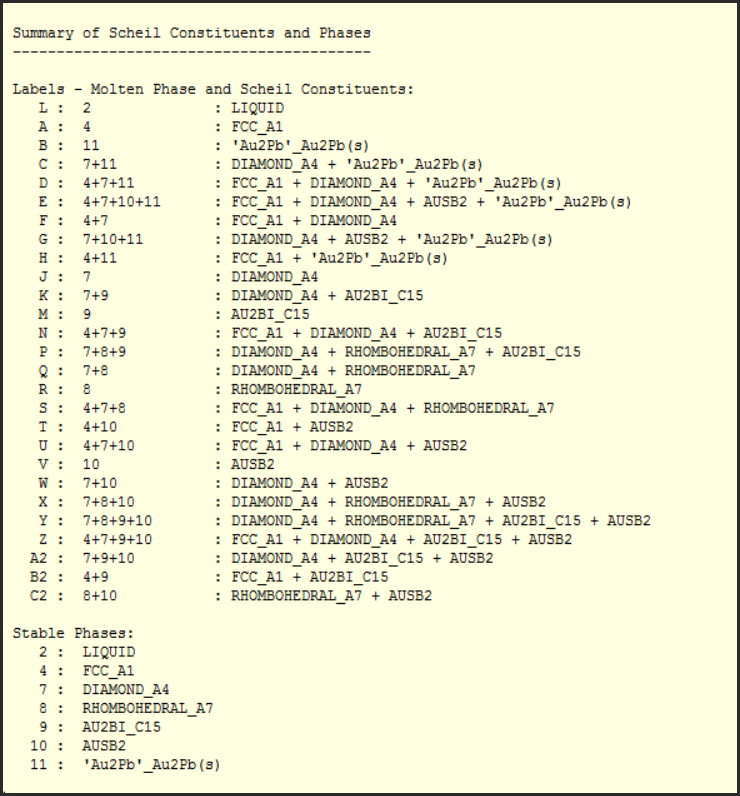
2 - List of the Scheil constituents and phases during Scheil cooling of Au-Bi-Sb-Ge-Pb
Ag5Te3 AgBrCH5N AgBrH3N AgBrH9N3 AgCClH5N
AgCNO AgCNS AgC2H3O2 AgClH3N AgClH9N3
AgFH4O2 AgFH8O4 AgIO3 AgN3 Ag2O3
Ag2SO3 Ag2SeO3 Ag2SeO4 AlB3H12 AlB3H12
AlCH2NaO5 AlC3H9 AlCl6Fe AlH12N3O15 Al2C6H18
Al2H12O18S3 Al2Sr Al4Sr Al7Sr8 AmCl2
AmCl2 AmCl3 AmCl3 AmO AsO6Sb3
As2O6Sb2 As3O6Sb As4Se3 As4Se3 AuO4Re
B5Mo3 BCH3O BC2H7O2 BC2H7O2 BC3H9
BC3H9 BC3H9O3 BC3H9O3 BC4H14N BC6H15
BC6H15 BCl3H3P B13Mo6 B4S6 BaBr2H2O7
BaBr2H4O2 BaBr2O6 BaCl2H2O BaCl2H4O2 BaCl2H6O11
BaCl2O4 BaF6Si BaH18O10 BaH2I2O7 BaH2N6O
BaH8O12Re2 BaI2O6 BaO3Se BaO4Se BaO4SrTi
BaSe BeSe BeTe BiNa3O4 Bi2Te
C3Nb4 C5Pu6 C7Nb8 C7Pu8 C7V8
CNp CNb C2Th C2U C17U9
C2CaH2O5 Ca24Cu29O56 Ca10F2O24P6 CaCl2H12O6 CaCl2H8O8
CaFeO6Si2 CaH12I2O12 CaH4O5S CaH4O6Se CaH6O9P2
CaI2O6 CaO6P2 Ca12H14O31Si6 Ce4Ru3 Ce7O12
Ce6O11 Cl7Nb3 Cl8Nb3 CoSb Cr6S7
FeO FeSe Fe2Se2 Fe3Si7 FeTe
Mo9O26 NV2 NiSe Ni7Se8 NiTe
O8Pu5 O19W7 O3W O26W9 S2U
Ca2Sn(s) has been added to the FTlite compound database.
The binary BINS database has been updated to be consistent with the new SGTE(2017) database
The SGTE(2017) database represents a significant update and revision of the previous SGTE(2014) alloy database.
Ag, Al, Am, As, Au, B, Ba, Be, Bi, C, Ca, Cd, Ce, Co, Cr, Cs, Cu, Dy, Er, Eu, Fe, Ga, Gd, Ge, H, Hf, Hg, Ho, In, Ir, K, La, Li, Lu, Mg, Mn, Mo, N, Na, Nb, Nd, Ni, Np, O, Os, P, Pa, Pb, Pd, Pr, Pt, Pu, Rb, Re, Rh, Ru, S, Sb, Sc, Se, Si, Sm, Sn, Sr, Ta, Tb, Tc, Te, Th, Ti, Tl, Tm, U, V, W, Y, Yb, Zn, Zr
Approx. 180 new SpMCBN phase diagrams have optimized and added to the 'list of stored phase diagrams' bringing the total to 633.
B-C-Cr B-C-Hf B-C-Mo B-C-Nb B-C-Ni B-C-Sc B-C-Si B-Co-Cr B-Co-Hf
B-Co-Mo B-Co-N B-Co-Nb B-Co-Re B-Co-Si B-Co-Ta B-Co-V B-Co-W
B-Co-Y B-Co-Zr B-Cr-Fe B-Cr-N B-Cr-Sc B-Cr-Y B-Fe-Hf B-Fe-N B-Fe-Sc
B-Hf-Re B-Mo-N B-Mo-Y B-N-Nb B-N-Ni B-N-Ta B-N-Y B-Ni-Re B-Ni-Sc
B-Re-Sc B-Re-Si B-Re-Ta B-Re-Ti B-Re-V B-Re-Y B-Re-Zr B-Sc-W B-Sc-W
B-Si-Y B-W-Y
C-Co-Hf C-Co-Nb C-Co-Si C-Co-Ta C-Co-Ti C-Co-V C-Co-Zr C-Cr-Hf C-Cr-N
C-Cr-N C-Cr-Re C-Fe-Hf C-Hf-N C-Hf-Re C-Mo-Re C-N-W C-Nb-Re C-Re-Si
C-Re-Ta C-Re-Zr C-Sc-Ti C-Sc-Zr C-Si-Ta
Co-Mo-Si Co-N-Nb Co-N-Si Co-N-V Co-Nb-Si Co-Sc-Si Co-Si-Ti Co-Si-W
Cr-Fe-Si Cr-Hf-N Cr-N-Ti Cr-Sc-Si Cr-Si-Y
Fe-Mn-Si Fe-Mo-N Fe-N-Nb Fe-N-Ti Fe-N-W
Hf-N-Si
Mo-N-Ni Mo-N-V Mo-Si-Y
N-Nb-Si N-Nb-Ta N-Ta-Ti N-Si-Ta N-Si-Ti N-Si-Y N-Si-Zr
Nb-Si-V
Ni-Re-Si
Re-Sc-Si Re-Si-Y
Sc-Si-Ta Sc-Si-V Sc-Si-W
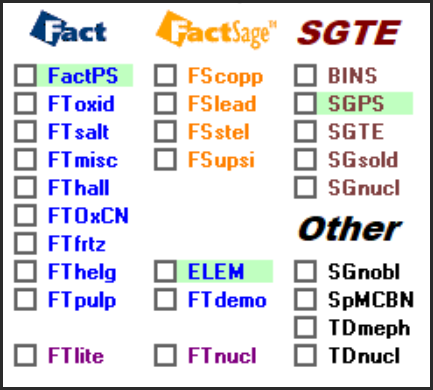
Screenshot showing the summary of public databases in FactSage 7.2.
4. Previous FactSage Versions
The following are summaries of the more important programming changes in
Equilib, Phase Diagram, Macro Processing and Databases that have appeared in
FactSage 6.1 (2009), FactSage 6.2 (2010), FactSage 6.3 (2012), FactSage 6.4 (2013),
FactSage 7.0 (2015), FactSage 7.1 (2017) and FactSage 7.2 (2018).
The following are summaries of the more important programming changes in each release.